housing market

Housing sector is showing signs of picking back up: Powell 

Housing sector is showing signs of picking back up: Powell 

Powell said the Fed will "proceed carefully" as whether to tighten further or hold the policy rate constant

In a hawkish tone, Jerome Powell said that Federal Reserve (Fed) officials are prepared to raise the federal funds rate further and hold it at high levels until they are confident that inflation is moving sustainably down to the 2% target. And that’s unclear at this point.

There are some sources of pressure on U.S. prices — among them is the housing market, Powell said Friday morning during an economic policy symposium in Jackson Hole, Wyoming. 

“So far this year, GDP [gross domestic product] growth has come in above expectations and above its longer-run trend, and recent readings on consumer spending have been especially robust,” Powell said. 

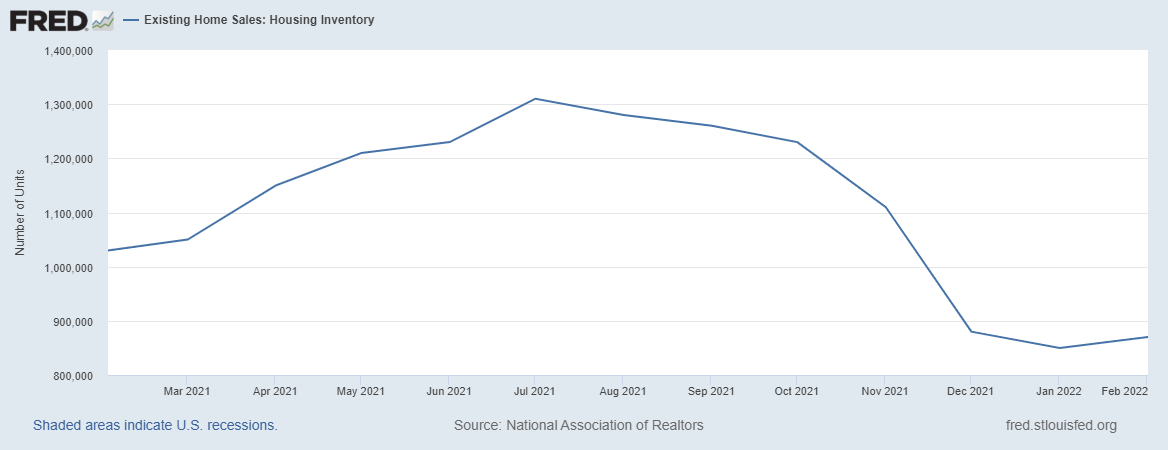
“In addition, after decelerating sharply over the past 18 months, the housing sector is showing signs of picking back up. Additional evidence of persistently above-trend growth could put further progress on inflation at risk and could warrant further tightening of monetary policy.”

Powell said that the effects of monetary policy became apparent soon after liftoff in the housing sector. Mortgage rates doubled in 2022, causing housing starts and sales to fall and house price growth to plummet. 

In fact, mortgage rates kept an upward trend in 2023, following the Fed’s moves to combat persistent inflation. On Friday, the 30-year fixed mortgage rate was 7.37% at Mortgage News Daily, the highest in over two decades. Economists see rates potentially reaching the 8% level

Regarding the housing services inflation, Powell said it lagged the monetary tightening. According to him, the main concern here is rents, which have only begun to slow down. “We will continue to watch the market rent data closely for a signal of the upside and downside risks to housing services inflation,” he said. 

Other components of inflation show different trends.

Core goods inflation has fallen sharply due to tighter monetary policy and the slow unwinding of supply and demand dislocations. Less sensitive to the Fed moves, nonhousing services, which account for over half of the core PCE and include items such as health care and transportation, have moved sideways since liftoff, Powell said. 

The labor market continues to rebalance, with improved supply and moderated demand. This rebalancing has eased wage pressures. The Fed expects the trend to continue, but evidence that the tightness in the labor market is no longer easing could also call for a monetary policy response, Powell said. 

Committed to the 2% target 

The core PCE inflation index, closely watched by the Fed officials, peaked at 5.4% on a 12-month basis in February 2022 and declined gradually to 4.3% in July 2023. 

The lower monthly readings in June and July of 2023 were welcome but only “the beginning of what it will take to build confidence that inflation is moving down sustainably toward our goal,” Powell said.

“We can’t yet know the extent to which these lower readings will continue or where underlying inflation will settle over coming quarters. Twelve-month core inflation is still elevated, and there is substantial further ground to cover to get back to price stability.”

The Fed, however, remains committed to the 2% inflation target, Powell said. It’s challenging to know when such a stance has been achieved in real-time, he remarked. 

Despite Powell seeing the current rate as restrictive to the economy, he can’t identify with certainty the neutral rate of interest – the rate at which monetary policy is neither stimulating nor restricting economic growth – which brings uncertainty about how high rates should be. In addition, it’s not clear the duration of the lags with which rate hikes affect economic activity and inflation. 

“As is often the case, we are navigating by the stars under cloudy skies,” Powell said. “We will proceed carefully as we decide whether to tighten further or, instead, to hold the policy rate constant and await further data.”  

Subscribe to Housing Wire.

Home showing traffic hits double-digit decrease in April

The West sees the largest annual decreases at 35.3%

Home showing traffic across the U.S. dropped off in April, according to ShowingTime’s Showing Index report released Tuesday.

In April, home showing traffic was down 10.7% year over year and 12.1% month over month, with a nationwide average of 8.49 showings per listing. In total, 103 of the markets analyzed hit a double-digit ratio of showings per listing in April, down from 121 a month prior and 146 a year prior.

ShowingTime’s index is compiled using data from more than 6 million property showings scheduled across the country each month on listings using ShowingTime products and services. In addition, it tracks the average number of appointments received on active listings during the month.

While ShowingTime acknowledges demand started tapering off this spring, compared to the frenetic level of activity a year ago, experts still believe there’s robust buyer activity.

“April buyer activity was rather unusual, since it typically matches March levels,” Michael Lane, ShowingTime’s vice president and general manager, said in a statement. “But this year, April traffic was slower across all markets, pointing to competition softening. It contrasts with last year’s dynamic, when demand reached a feverish peak in April.” 

The nation’s 25 busiest individual markets averaged more than 14 showings per listing. Topping the list was Burlington, Vermont, with an average of 20.3 showings per listing, up 16% year over year, followed by the Bloomington-Normal metro area in Illinois, with 16.4 showings per listing, a year-over-year increase of 62%. Richmond, Virginia (15.6 average showings per listing), Denver, Colorado (15.5), and Akron, Ohio (15.2) rounded out the nation’s top five.

On the other end of the spectrum for average showings per listing in April were Kansas City, Missouri (13.2), Fort Collins, Colorado (13.2), Detroit (13.1), Spokane, Washington (13), and Boulder, Colorado (12.9).

All four major U.S. regions saw year-over-year decreases in showings per listing, with the West recording the largest decrease at 35.3%, followed by the South (11.6%), the Northeast (8.6%), and the Midwest (7.3%).


Need help navigating this market shift?

We’re Hiring.

NAR’s Yun: ‘The Market Is Quite Unusual’

For the third consecutive month, existing-home sales fell, but buyers are still eager. Higher mortgage rates and prices and low inventory continue to chip away at affordability. Some regions of the U.S., however, continue to see gains.

Nationwide, existing-home sales—completed transactions of single-family homes, townhomes, condos, and co-ops—decreased 2.4% in April compared to March, according to the National Association of REALTORS®’ latest housing report. Sales are down 5.9% year over year.

“The market is quite unusual as sales are coming down, but listed homes are still selling swiftly, and home prices are much higher than a year ago,” says Lawrence Yun, NAR’s chief economist.

Still, higher home prices and sharply higher mortgage rates are beginning to reduce buyer activity in many markets, he adds. “It looks like more declines are imminent in the upcoming months, and we’ll likely return to the pre-pandemic home sales activity after the remarkable surge over the past two months,” Yun says.

Here’s a closer look at the key indicators from NAR’s latest housing report.

  • Home prices: The median existing-home sales price increased at a slower year-over-year pace of 14.8% in April. Median home prices were $391,200 nationwide. Home prices continued to increase in every region of the U.S.

  • Days on the market: Eighty-eight percent of homes sold in April were on the market for less than a month. Properties remained on the market for 17 days in April, the same as last month and as a year ago.

  • First-time buyers: First-time home buyers comprised 28% of sales in April, down from 31% a year ago.

  • Investors and second-home buyers: Individual investors and second-home buyers accounted for 17% of home sales in April, the same as a year ago. These buyers tend to make up the bulk of all-cash sales, which accounted for 26% of transactions in April, also about the same as a year ago. “The cash buyers, not impacted by mortgage rate changes, remain elevated,” Yun says.

  • Distressed sales: Foreclosures and short sales remain historically low, representing less than 1% of sales in April and down from 2% a year earlier.

  • Housing inventory: Total housing inventory is up 10.8% in April compared to March and down 10.4% from a year ago. Unsold inventory sits at a 2.2-month supply at the current sales pace. “Housing supply has started to improve, albeit at an extremely sluggish pace,” Yun says.

Even with some improvement, the nation has a long way to go in reversing years of underbuilding and low inventory, NAR notes. “As we find ourselves in the midst of a massive housing shortage, NAR continues to work with leaders across the private and public sectors to help close this deficit,” says NAR President Leslie Rouda Smith. “As the nation’s largest real estate association, we are urging policymakers to enact zoning reforms, homebuilder incentives, and other necessary regulations to help correct this situation.” The Biden administration made an announcement this week with a proposal to try to improve America’s housing shortfall. Read more: Biden Administration Takes Aim at America’s Housing Shortage

Regional Breakdown

The following is a closer look at how existing-home sales fared across the country in April, according to NAR’s sales report.

  • Northeast: Existing-home sales increased by 1.5% in April, reaching an annual rate of 670,000, a 10.7% drop from a year ago. Median price: $412,100, up 8.1% from April 2021

  • Midwest: Existing-home sales rose by 3.1% from the prior month to an annual rate of 1.31 million in April, a 1.5% decrease from a year ago. Median price: $282,000, an 8.7% increase from one year ago

  • South: Existing-home sales dropped by 4.6% in April, recording an annual rate of 2.49 million, a 5.7% decrease from one year ago. Median price: $352,100, a 22.2% increase from a year earlier. The South is the only region to report year-over-year double-digit price gains.

  • West: Existing-home sales fell by 5.8% in April, reaching an annual rate of 1.14 million, down 8.1% from one year ago. Median price: $523,000, up 4.3% from April 2021


Why Housing Inventory is so Low Right Now

You have to understand the difference between the new and existing home sales markets

By Logan Mohtashami for Housing Wire

Given the current housing inventory crisis, it might surprise people to realize this: we built too many homes during the housing bubble years. Wait, what? But we have a housing shortage, right? Yes, but this is where my work is much different from other housing economists and why we need to think of inventory in a new, modern 21st-century mindset.

The big theme of my housing work since 2010 has been that the housing market would have its weakest recovery from 2008 to 2019 because we simply built too many homes versus the real demand curve, and monthly supply proves that. If you look at the monthly supply for new homes from 1996 to 2005, it was always lower than what we saw from 2008 to 2019. New home sales were working from the lowest levels ever, but sales kept on disappointing analysts and economists.

We had a few years where sales missed expectations in 2013, 2014, and 2015. Then in 2018, when mortgage rates got to 5%, we had a supply shock for the builders, which in essence stalled out construction for 30 months.

New home sales were much more substantial, of course, heading toward the bubble peak of 2005, so as long as sales rose, the homebuilders would build. Then we had an 82% crash in new home sales, and the weakest new home sales recovery ever after 2010..

One of my big calls in the previous expansion was that we wouldn’t see housing starts begin a year with 1.5 million total housing starts until 2020-2024, when demand would warrant that many housing starts. I wrote about this topic last year: Why we can’t build our way out of this hot housing market.

The new home sales market is always in competition with the existing home sales marketplace because that marketplace has a much more significant inventory with cheaper, older homes. So homebuilders can’t just put their head down and overbuild. On top of all the drama we have, housing completions look terrible, so there is some risk to the builders’ business model now that rates have risen. 

The monthly supply of new homes is different than the monthly supply of existing homes. The existing home sales monthly supply is 1.7 months versus 6.3 months for the new home sales market.


So how should we look at the inventory situation? Everyone has their way of looking at inventory, so let’s take a look at the different approaches.

Mike Simonsen, founder and CEO of Altos Research, does a great job looking at the single-family inventory each week, using Altos’ real-time snapshot of what’s going on. Inventory is seasonal, rising in the spring and summer and fading in the fall and winter. So, we want this data line to be positive year over year, not negative.


The National Association of Realtors provides a monthly snapshot of inventory with its existing home sales report. I use this data line to give people a realistic take on the landscape of housing inventory with the existing home sales marketplace. Inventory from 2010 to 2019 was high enough that we didn’t see major bidding wars. However, inventory has broken down to such low levels that unhealthy bidding wars are more common since 2020.

Inventory is very seasonal and we are about to get the spring and summer increases in inventory we see every year. We want the total inventory to rise and the total inventory data to be positive year over year. We want to get back to a range of 1.52 – 1.93 million homes, which would mean the madness in the housing market would be over.

Once total inventory can get back into the range of 1.52 million to 1.93 million, I can take off the unhealthy housing market label. I hope higher rates do their thing regarding cooling down price growth and creating more days on the market. Yes, I know home sellers will pull back with higher rates, but you can see the issue with the existing home sales marketplace that doesn’t exist with the new home sales market.

Right now, an American homeowner with a sub 3.25% mortgage rate has the best hedge against inflation, and they are looking great. In contrast, the new home sales supply inventory channels don’t have a homeowner who has been in their homes for 10-20 years.

Hopefully, this explains some of the different dynamics between the new home sales market and the existing home sales marketplace. Because my home-price growth model of 23% in five years accelerated so fast in just two years, I am rooting for more inventory and prices to cool down noticeably so I can get ready for the year 2025. That’s an entirely different conversation altogether, but we will cross that bridge when we get there. For now, let’s root for more total existing home inventory.

See all of the tweets, charts + data on Housing Wire.

Agents work to ensure their survival during one of the most challenging markets in history

How is the housing market impacting real estate agents?

George Schechter has an entirely new business model. A real estate agent at Compass Florida in Coconut Grove, Schechter has 12 years of experience in the real estate industry, so he’s familiar with its cyclical ups and downs. But today’s housing market has forced him to pivot to remain successful.

“This market is like nothing we’ve ever seen,” he said. “In certain neighborhoods, such as Coconut Grove and Coral Gables, we’re at 25-year lows in inventory, with buyer demand I’ve never experienced.”

A recent example of the frothy market in South Florida: Schechter listed a house in Coconut Grove on a Friday at 7 a.m. for $895,000. By 10 a.m., he had 62 showing requests and by Monday, 27 offers. The house sold for $1.5 million.

There’s plenty of advice available to help buyers and sellers navigate the current housing market. But what about real estate agents? What are they doing to adapt and ensure their survival during one of the most challenging markets in history?

“So many people got into the business last year because of the pandemic,” said Sherri Johnson, a national real estate coach and speaker. “Licenses went up dramatically due to job changes, and it does weed out the amateurs, the folks who can’t adapt to change fast enough. The cream of the crop always rises, though – anyone who is a good agent can sustain any type of economic or health crisis or any issue going on in the country.”

Challenging times

Schechter has pivoted to survive in one of the most competitive housing markets in the country. According to the Miami Association of Realtors, real estate in Miami-Dade County posted its best April sales month in history. Total home sales surged 151.3% year-over-year, single-family luxury ($1 million and up) transactions jumped a whopping 541.1 percent and median prices increased 34.8 percent year-over-year in April.

Redfin recently reported that the housing market was more competitive in April than any time since the company began tracking national housing data in 2012. A typical home that sold in April went under contract in 19 days, 16 fewer days than a year earlier and the fastest pace on record. And in April, 49% of homes sold above list price, the largest share on record.

Danny Hazim, 25, an agent with DLP Realty in Bethlehem, Pa., now works seven days a week, 12 hours a day. He gets up at 8 a.m., goes through emails, then gets on the road for showings, arrives home at around 7 p.m. and writes offers. “It’s very stressful and tough,” he said. Now in his third year in the business, Hazim expects to close over 50 deals this year. But that might sound better than it is.

“If I sell a house and make a $3,000 commission, it might have taken me six months to make that,” he said. “If you count all the driving, all the time and the money spent on gas, it’s so little.”

Indeed, according to the National Association of Realtors 2021 Member Profile, the median gross income for a Realtor in 2020 was $43,330, down from $49,700 in 2019. Realtors with 16 years or more experience had a median gross income of $75,000, a decrease from $86,500 a year earlier. Only one out of four Realtors earned $100,000 or more.

Dealing with sales

Schechter, of Compass, has changed how he handles the listings that are so difficult to come by these days. Rather than listing a home in the MLS, waiting for showings and then for offers to eventually roll in, Schechter creates a sense of urgency by listing homes on Thursdays, holding open houses on the weekend and then asking for “best and brightest offers.” With 165 people showing up at a recent open house, he’s found that to be a more effective way to show a house than to arrange individual tours.

Once the offers come through – he recently received 27 offers on a listing  – he prepares an Excel spreadsheet that lays out all the details of each offer, from closing date to purchase price, financing details, down payment and inspection period. He goes through each offer, making sure his clients understand all the terms, and then they choose.

Schechter, who refers to himself as a “bona fide real estate geek,” also spends about seven to eight hours a week studying homes on the market. “Even if I don’t have clients interested in them, I can now turn a buyer I meet on the phone into a hard-contract buyer within 72 hours just based on that knowledge,” he said.

Bidding wars galore

While real estate agents are faced with a lack of inventory on the sales side, they’re also coping with frustrated buyers.

Craig Brody, an agent for Douglas Elliman in Boston, has only been in the industry for three years, but he’s noticed the changes. “There’s not any inventory,  and you are going out with buyers desperate to get a place, putting offers on homes they don’t even love – and then not getting them,” he said. “It’s very tiresome.”

To avoid wasting his time, Brody now tells buyers they need to be prepared to make an offer on the spot if they see a house they like — and that the offer needs to be over list to be successful. “I tell them if they’re not willing to go eight to 10% over asking, they have no shot,” he said. “Our time is our money – when there’s no inventory, and they’re getting 15 or 20 offers on a place, it feels like you’re just wasting time.”

Alison Malkin has another strategy — when there’s no inventory available for her buyers to purchase, she creates it. “I have a sphere of influence with past clients,” she said. “I always stay in touch and ask them for business, but I’ve intensified that.” Instead of reaching out once a quarter, she is now in touch once a month, keeping them posted on market conditions and helping them craft a plan to capitalize by selling their home at the peak of the market. Malkin, broker/owner of RE/MAX Essentia [cq] in Avon, Conn., has closed eight off-market deals since January by knocking on doors to see if people are interested in selling.

Self-care essential

Certainly, buyers are frustrated when they spend weeks looking for a home, making multiple offers and not winning any. Hazim said he recently worked with a couple who made more than 12 offers on homes and were outbid each time. “It was very tough to give them the news that they didn’t get the house because I knew how badly they wanted it,” he said.

Gloria Castellanos, an agent with The Agency in Beverly Hills, Calif., said one of her clients got very emotional — crying — when she lost a house in a bidding war. “I’m not made of stone,” she said. “I’ve been doing this a long time so I try my best to set expectations right from the beginning, but I feel their emotional pain.”

To cope, Castellanos makes sure she takes care of herself. “I do my self-care so I can be there for my clients,” she said. “My workouts and morning routine are super important to be mentally prepared for what the day brings. Whether it’s reading, journaling or meditating, real estate agents should make some time for themselves to make sure their mind is clear.” 

Johnson, the coach, said that any agent can survive this market if they’re flexible and adapt. “They need to re-engineer how they look at the business,” she said. “Instead of thinking that something is in the MLS, they have to make it happen. That will create an anything-proof, recession-proof, health-crisis-proof economy for any real estate agent.”